Astronomy
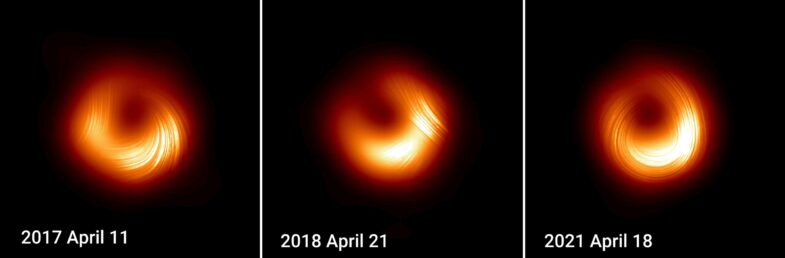
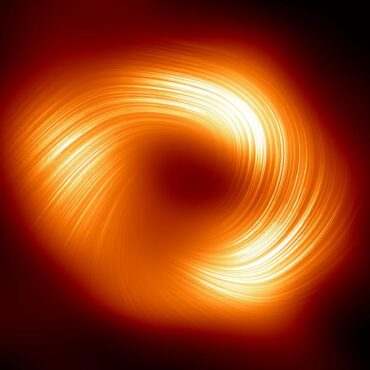
Astrophysical research at Haystack makes use of astronomical instrumentation at the cutting edge of technology. Instrument development and astrophysical research thus proceed hand-in-hand. This connection is showcased by the Event Horizon Telescope and EDGES projects, both of which deliver fundamental insights into the cosmos. Astronomers at the Observatory also carry out research using national and international facilities, as well as telescopes at the Haystack site. Specific astronomy and astrophysics research programs undertaken at Haystack are described on our astronomy projects page.
The Astronomy research group contributes substantially to the educational activities of the Observatory. One example is the Small Radio Telescope, conceived at Haystack to provide research and educational experiences for STEM students around the world. Haystack astronomers are also part of the Northeast Radio Observatory Corporation (NEROC) network, which facilitates the coordination of research and education activities with project partners across the northeastern United States.
Spotlight Projects
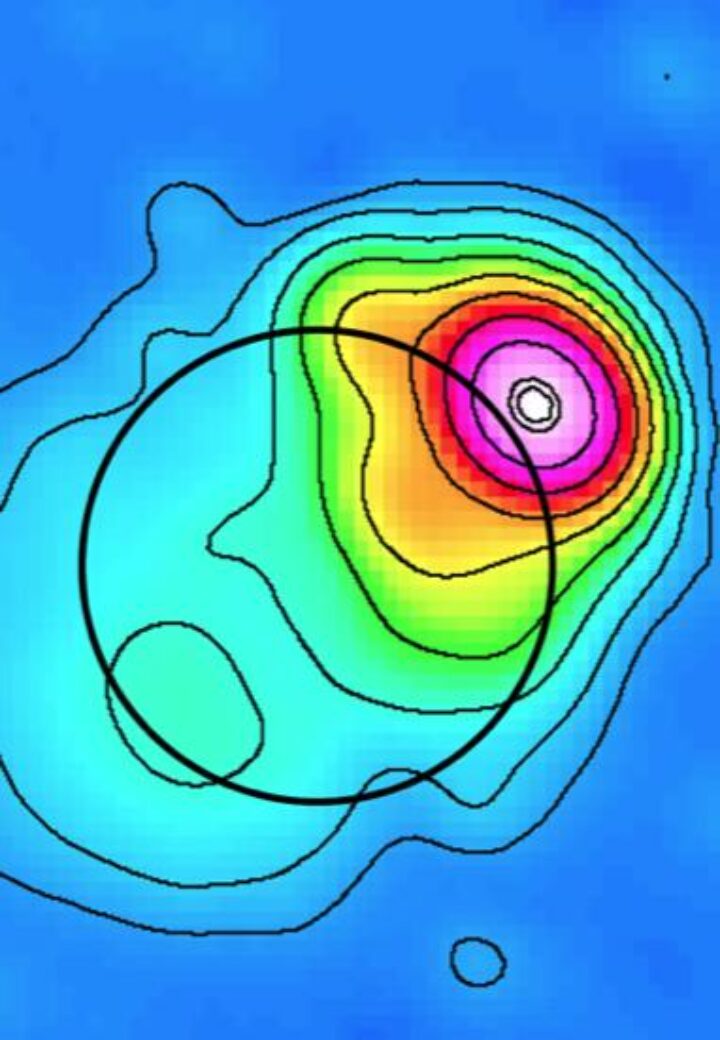
Black Hole Explorer (BHEX)
A new mission to measure a black hole's photon ring, capturing light orbiting a black hole.
LEGO
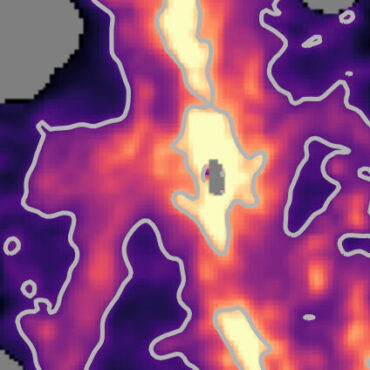
LEGO studies star-forming sites in the Milky Way in order to better understand similar regions in nearby galaxies. It uses the most comprehensive wide-field atlas of molecules in space to do so.
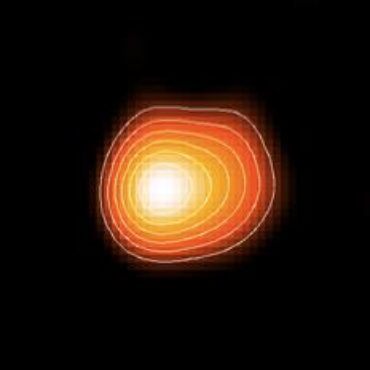
Radio Stars
All stars emit radio waves. The study of stellar radio emission provides unique insights into the lives of stars that cannot be obtained by observations at other wavelengths.
)