Haystack VLBI Correlator
The Haystack VLBI Correlator is dedicated to geodesy (sponsored by the NASA Space Geodesy Program) and astronomy (sponsored by the National Science Foundation).
Major programs supported by the Haystack correlator include the International VLBI Service for Geodesy and Astrometry (IVS) and the Event Horizon Telescope (EHT).
The correlator also serves as a crucial development system for testing new correlation modes and recorder development. The correlator team also provides VLBI software support to institutions worldwide. The team is an active contributor to the DiFX (Distributed FX) Correlator software project.
VLBI has a long history (5 decades) at Haystack. The VLBI technique provides an extremely precise measurement of the geometric relationship between the receiving telescopes and the celestial target. Depending on the choice of targets and observing program, some of the highest precision results may be obtained in geodesy (measuring the Earth) and astronomy (measuring the stars).
Geodesy
A geodetic observing program uses observations of well-known reference targets (quasars) to make high precision measurements of the Earth. In the early years this led to the first measurements of continental drift. In later years this led to detailed studies of all of the effects (atmospheric tides, motions of the Earth’s crust, &c.) which can contribute to delays on the signal paths between the quasar and the telescope. Our current focus is to push the precision of measurement to the level of a few picoseconds or millimeters in a day. The current limit is placed by the variability of the atmosphere, so the observing program consists of very short (seconds) observations on many targets designed to average over these fluctuations. With this high level of precision, VLBI thus provides the best measurement for UT1 (telling time with the spinning Earth) and fixes the Earth within the celestial reference frame.
Astronomy
As astronomy observing program takes the observatory locations as known and builds an observing program to study interesting celestial targets. Since these are generally weaker targets (and observed at higher frequencies) than those used in geodesy, the scans are generally longer (minutes) to allow the target to be detected and measured relative to the receiver noise. The observing program also tries to follow the science targets from rise to set (if the array allows) to get a large selection of viewing aspect on the target. These observations can then be analyzed to make flux measurements and images of the targets. An obvious recent example is the recent M87* image obtained with the EHT.
Correlation
Whether for astronomy or geodesy, the signals recorded are dominated by the receiver noise. The VLBI technique relies on finding a way to average out the random noise to find the coherence signal of the celestial target. Fortunately, this part is relatively easy: on every baseline between two recorded signals, we may perform a correlation of those two signals. In this correlation, the noise averages out, and the signal builds up as more and more recorded data is combined provided the correlation parameters are set up exactly right. If, for example, the delay between the two signals is not correct, then the signal averages out along with the receiver noise and a null result is obtained. The two principal parameters are the delay between the two stations and its change as the Earth rotates (delay-rate). Usually (to increase sensitivity) the recorded data is subdivided into many sub-bands, each of which may have its own delay and delay-rate. (But of course, there is only one Earth, so this large set of parameters must be found consistently.)
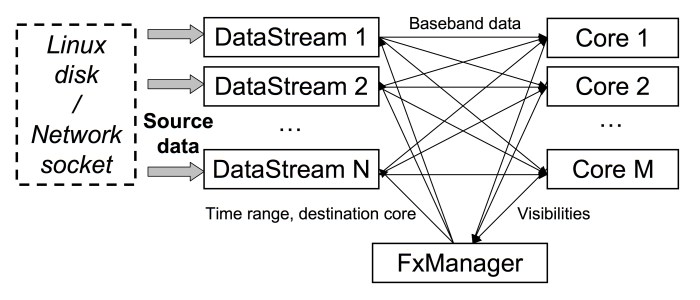
The catch is that there is a large amount of data (terabytes for geodesy or astronomy and petabytes for the EHT) and so special playback units to feed the correlator at a high rate (many Gbps per data stream) and a sizable computing framework to perform the correlation are required. The DiFX project software is currently widely used by many VLBI correlators around the world to perform this calculation on a supercomputing cluster. It includes software to automatically convert the VLBI experiment design/program, encoded in a VEX (VLBI Experiment) file into detailed instructions for reading the data from the playback units, considering the changing geometry of the Earth’s rotation to properly time-align the samples, correlate the signals and collect the results. Since we ultimately require the correlation to be expressed in spectral space, there are two parts to the calculation: correlation (X) and frequency transform (F) and they may be done in any order. In the current era, aside from a few special cases, it is more efficient to perform the F step first and the X step second. That combined with efficiently distributing the work gives the name to the DiFX software. The entire process is shown in the following illustration.
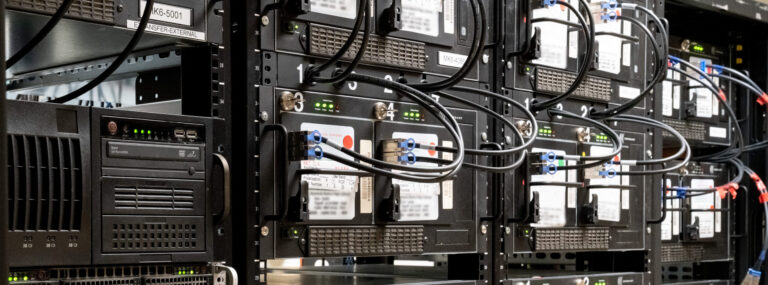
In the computing cluster at Haystack, we have several generations of Intel multi-core processors (6 v1 dual-hexa-cores, 16 v2 dual-deca-cores, and 38 v4 dual-deca-ores) for an total of 1152 compute cores. Generally one playback unit is required per observing station, so we have 11 Mark6 playback units. Because of the asymmetry of the data flow, we have 25 Gbps network paths to the processing nodes but a higher path to the playback units (40 or 50 Gbps). It is all connected with one 100 Gbps network switch. Additional nodes support control and management of the cluster as well as close to 200 TB of temporary storage (for times when more than 11 stations are needed, or when data is delivered via the internet).
Once the data is correlated, it is delivered to the experiment teams for analysis, usually with the Haystack Observatory Post-Processing (HOPS) software.