Haystack climate change research: how fast are icebergs melting?
Pedro Elosegui has co-authored an article for Geophysical Research Letters (GRL) on “Measurements of iceberg melt rates using high‐resolution GPS and iceberg surface scans” (Schild et al. 2021, https://doi.org/10.1029/2020GL089765).
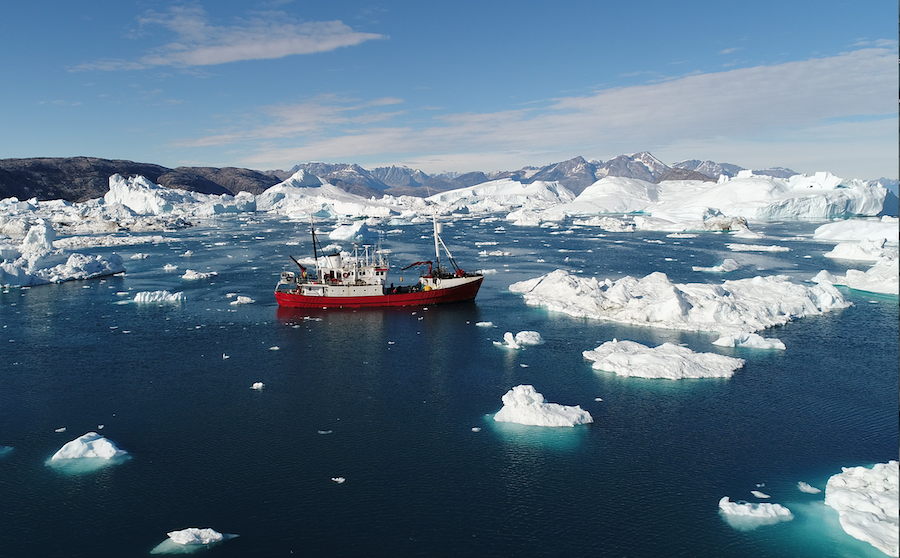
As the Earth’s climate warms, a greater number of icebergs are calving, or breaking off, from glaciers in Greenland (and elsewhere). Glaciers and ice sheets are part of the land mass; therefore, when ice calves from glaciers, its mass enters the ocean and raises sea level. And as icebergs melt, they continue their impact by releasing freshwater into the ocean, changing the salinity levels and also affecting how water circulates in these regions.
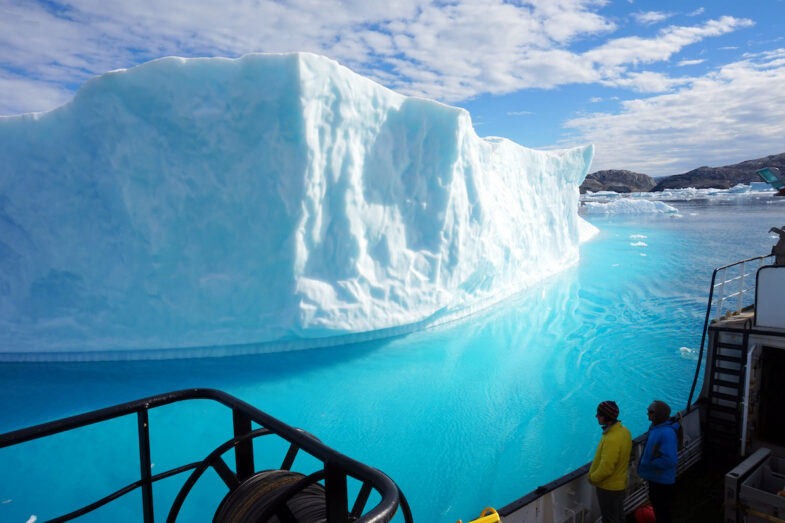
To study these effects, Haystack scientists and colleagues are measuring the rates at which icebergs melt. In the latest research published in GRL, data was obtained by deploying GPS units on icebergs in Greenland fjords, and reconstructing the full geometry of the icebergs by using aerial drones and underwater sonar. Being able to capture iceberg melt rates at the same time as measuring full Iceberg geometry was critical to the success of this study since iceberg geometry is constantly changing but has a controlling effect on the melt rates.
Elosegui, Haystack research scientist and geodesy group lead, said, “One virtue of having geodetic-quality GPS systems riding on floating icebergs is that measurements of vertical displacement have the fingerprints of ice melt, ocean tides, sea level, gravity, atmospheric pressure, and other geophysical effects. And because these measurements are expressed on a stable terrestrial reference frame, comparisons to observations made over time and across fjords and glaciers should also become possible.”
The paper’s lead author, Kristin Schild of the University of Maine, says, “This was a really exciting study, because it was the first of its kind to use high-resolution GPS units, specifically designed for iceberg deployment, to calculate melt rates in a critical location. We were able to capture iceberg deterioration on a sub-daily scale, meaning we can now use this information to predict the impact not only on fjord circulation, but also on regional biology, ecology, glaciology, and climate. We still have a lot to learn about how iceberg deterioration and increases in iceberg distribution are impacting the global ocean, but this study and these results are moving us towards being able to answer that question.”
The novel approach to using geometry to improve calculation of melt rates also found that previous studies underestimated the amount of iceberg surface area available for melting, and also that iceberg melt rates change with ocean depth. Future studies include a plan to combine these field measurements with satellite imagery to better predict the impact of melting icebergs on global ocean circulation.