Imaging geomagnetic storms in the Earth’s ionosphere—in 3D
Space weather variations in the region near our planet are of increasingly important interest for our space faring and communications reliant society. However, accurately imaging variations in the Earth’s ionosphere has always been a challenge for the space weather community, as the ionosphere is a highly complicated geospace environment that undergoes not only considerable climatological changes but also significant weather fluctuations in both space and time.
A recent study, published in March in the journal Space Weather and led by Ercha Aa and colleagues from both MIT Haystack Observatory and the NCAR High Altitude Observatory, develops a new total electron content (TEC)-based ionospheric data assimilation system, TIDAS, to provide high-fidelity regional 3D ionospheric information. TIDAS incorporates multiple types of ground- and space-based ionospheric observations, such as Global Navigation Satellite System (GNSS) TEC measurements, satellite radio data, and measurements by the Millstone Hill ionospheric radar facility at Haystack.
The mid-latitude ionosphere, especially over the continental United States, often shows complicated dynamics and electrodynamics due to substantial electron density gradients during geomagnetic storms, such as storm-enhanced density (SED) plumes. “An SED plume is an intriguing, large, and highly structured storm-time ionospheric disturbance that manifests as a substantial electron density enhancement along a sunward and poleward elongated channel in the local afternoon at mid- and subauroral latitudes,” says Shun-Rong Zhang, a research scientist at MIT Haystack Observatory. “Despite its large effects on the structure of the ionosphere, state-of-the-art knowledge about SED plumes remains insufficient, especially with regard to their 3D structure and the variability of dominant driving mechanisms.”
SED plumes and associated storm-time mid-latitude density gradients are important, as they can affect radio wave propagation. These and other ionospheric events can have detrimental effects on modern military and civilian infrastructures and technologies, such as GNSS navigation and shortwave communications. Imaging these ionospheric features in 3D will help improve awareness of their effects and eventually help mitigate their effects on our infrastructure and technology.
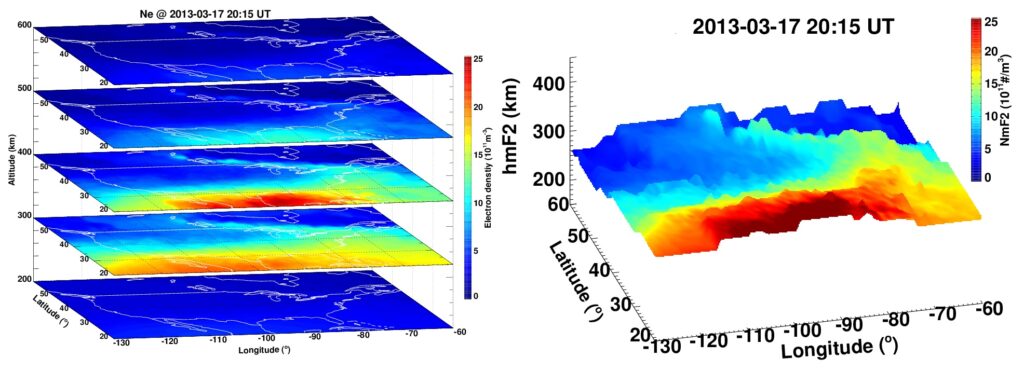
The TIDAS system will assimilate accurate and reliable three-dimensional electron density data from over the continental U.S. and adjacent areas, with a resolution of 1º x 1º in longitude and latitude, 20 km in altitude, and a 5-minute cadence. Researchers demonstrated in the Space Weather study that they can use the TIDAS data to accurately reconstruct the evolution of an SED plume observed during the major 2013 St. Patrick’s Day geomagnetic storm.
“This high-fidelity regional data assimilation system is a powerful tool to reconstruct localized storm-time ionospheric morphology in a fully 3D sense, with important fine-scale details,” says Philip J. Erickson, Haystack associate director and geospace sciences group lead. “TIDAS results can help advance our current understanding of the fine structures and underlying mechanisms of the midlatitude ionospheric density gradients during space weather events, especially in such structures as storm-enhanced density plumes.”
Note: TIDAS is a collaborative project sponsored by a grant from the National Science Foundation. GNSS data in the Haystack Madrigal database are enabled by community data providers.